In IoT-NGIN, we have adopted Google’s Nearby Connections as the baseline framework to put in practice the project’s advances in regard to data traffic offloading. One of the problems that we faced when developing applications using this framework is that the performance we observed diverged significantly from the theoretical numbers we found in the documentation.
That is why we decided to conduct a number of experiments and share our insights with the community. These experiments are detailed in a different blog post. Here, we discuss what we did to make the experiments viable. We have developed an Android application called AtomD that performs operations and procedures to exploit and stress all the functionalities provided by the Nearby Connections API. AtomD is available on Github.
In a nutshell, AtomD gathers several measures that are recorded in a database for further analysis. In terms of interface, it has two particular fragments for managing experiments. It is worth recalling that, in Android development, a fragment represents a modular portion of the user interface within an activity. The first fragment, called Dashboard, allows the user to define the roles (advertiser or discoverer) that a node can play in the D2D communication and allows the user to observe the status and progress of the connection. The second fragment, called Experiments, allows the user to set the different actions that the application can take during the D2D transfers.
We detail the two fragments in the following.
Fragment 1 – Dashboard
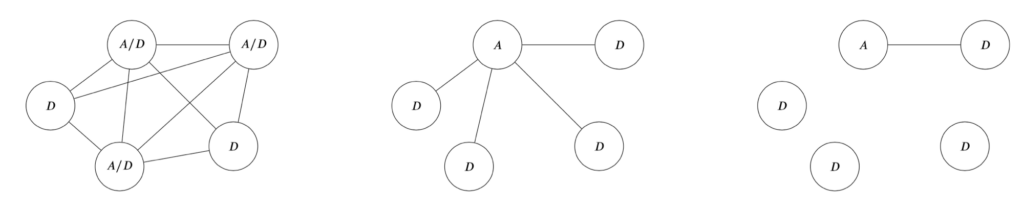
We structure the Dashboard fragment in four layers, as shown in Figure 1. In the first layer, we find the connectivity states during the realization of the D2D communication link. If a device performs Network Discovery Protocol (NDP), it will change its Discovery state to reddish; otherwise, it keeps a gray color. Similarly, if a device maintains at least one D2D connection with another device, it changes its Connected status to reddish; otherwise, it remains gray. In the top left corner of the second layer is the device ID, which is used as a human readable name for other users who want to discover the device.
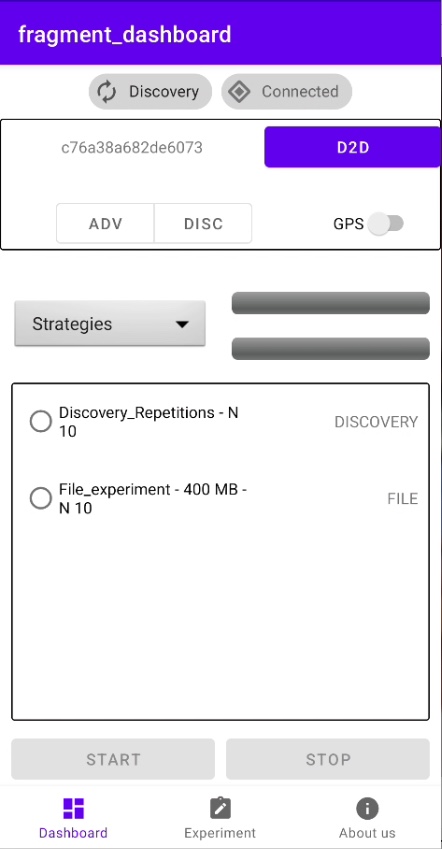
Figure 1. Nearby connections strategies: Features, usage, and empirical performance evaluation. Dashboard fragment where the user can perform and visualize the experimentation procedure. This layout is subdivided into four layers.
Below the ID, there is a button that allows the user to configure the role of the device – Disc. to configure the device as a discoverer and Adv. to configure the device as an advertiser. Finally, on the right side of the second layer, there is a button to generate a D2D instance and a switch that allows tracking of the GPS coordinates of the device.
In the third layer, there is a drop-down list of the three strategies provided by the Nearby Connections API on the left side. In contrast, on the right side, there are 2 bars representing the progress during a D2D transfer. The first one is used to represent a single transmission, while the second one shows the progress of the set of transmissions if transfers are done in batches.
Finally, the fourth layer shows a list of predefined processes to measure D2D performance, of which only one can be executed. We explain how a user can define a process in the next section.
⚠️ It is important to note that the user must select at least the role and the strategy to be able to initiate a D2D instance.
Fragment 2 – Experiment
To configure the behavior of the AtomD application and, consequently, of the D2D links, we have developed the Experiment fragment, illustrated in Figure 2.
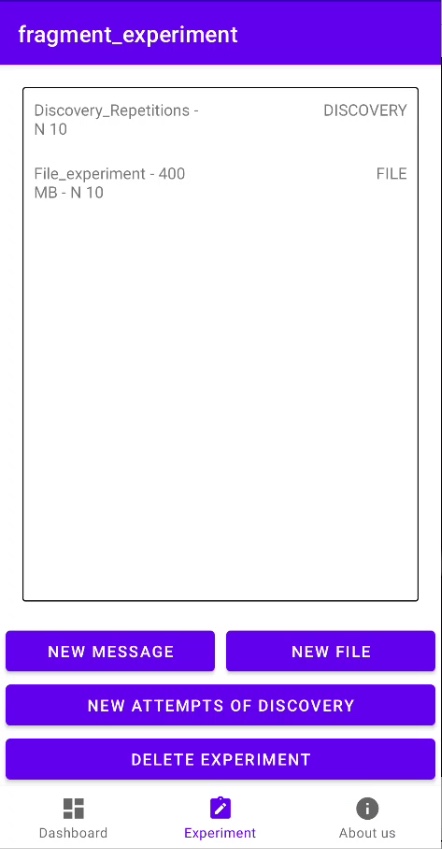
Figure 2. Experiment fragment, where its layout allows the user to create, view and delete experiments allowed by the application.
The user can configure three different types of experiments (or processes), which we explain in the following.
- Chunk experiment (see Algorithm 1). It sends a set of data chunks with a maximum of 1,047,552 B per chunk. Within the payload is set an instance ID of the experiment, the current GPS location of the device, and the counter tracking of the set of chunks that have been sent.
Algorithm 1: Chunk Experiment

Input:
	𝑗𝑝: Parameters to be sent, enclosed in a JSON object.
	𝑖𝑑: The ID of the device connected through D2D.
	𝑡𝑟: Number of transmission repetitions.
Output:
	False in case the transfer was not successful. Otherwise, True.

Function SEND_CHUNK(𝑗 𝑝, 𝑖𝑑 , 𝑡𝑟)
	𝑃 ← TO_PAYLOAD(𝑗𝑝)
	for 𝑟 ← 1 To 𝑡𝑟 do
		if SEND_PAYLOAD(𝑖𝑑, 𝑃 ) ≠ SUCCESS then
			return False
		end if
	end for
	return True
end

// For each successful reception, we record the reception time and the received
// parameters. 𝑃 is a variable containing a payload with the parameters to be sent.- File experiment (see Algorithm 2). It consists in performing a set of transmissions of the same file of size 𝑛 × 10^𝑚 B to one or more devices. Before sending the file, the transmitter sends a Chunk with tracking data to track the file to be sent. Within this chunk is set an ID of the experiment instance, the ID of the payload where the file is packed, the total number of repetitions that the file will be sent, and the metadata of the transmitter. During the transmission process, the transmitter and receiver will record in a database the information registered within the chunks, as well as the number of bytes expected and the bytes transferred for each sent file.
Algorithm 2: File Experiment

Input:
	𝑗𝑝: File parameters, enclosed in a JSON object.
	𝑓𝑙: File to be send.
	𝑖𝑑: The ID of the device connected through D2D.
	𝑡𝑟: Number of transmission repetitions.
Output:
	False in case the transfer was not successful. Otherwise, True.

Function SEND_FILE(𝑗𝑝, 𝑓 𝑙, 𝑖𝑑, 𝑡𝑟)
	P ← TO_PAYLOAD(𝑓𝑙)
	for 𝑟 ← 1 To 𝑡𝑟 do
		if SEND_CHUNK(𝑗𝑝, 𝑖𝑑, 1) = SUCCESS then
			if SEND_PAYLOAD(𝑖𝑑, P) ≠ SUCCESS then
				return False
			end if
			else
				return False
		end if
	end for
	return True
end

// During each file transfer, we log the number of bytes transferred,
// the time of their reception, and the corresponding file metadata chunk.- Connectivity experiment (see Algorithm 3). This experiment allows the devices to perform a set of NDP. Among the configurations, the user can set the device to use either Bluetooth classic or BLE for the discovery and connectivity request procedures. In the course of this experiment, AtomD records the times of radio initiation, device discovery, request sending, and request reception in nanoseconds. In addition, it also records the GPS location of each device.
Algorithm 3: Connectivity Experiment

Input:
	𝑟𝑛: Readable name of the device connected through D2D.
	𝑐𝑟: Number of connections repetitions.
Output:
	In case it does not find an matching 𝑟𝑛, then the device will keep listening to the channel.

Function CONNECTIVITY_REPETITIONS(𝑟𝑛, 𝑐𝑟)
	for 𝑟 ← 1 To 𝑐𝑟 do
		DISCONNECT_FROM(𝑟𝑛)
		START_DISCOVERY()
		if GET_DISCOVERED_DEVICE() = 𝑟𝑛 then
			ESTABLISH_CONNECTION_WITH(𝑟𝑛)
			STOP_DISCOVERY()
		end if
	end for
end

// During each run of the NDP, we record when the discovery process was initiated,
// when the target device was discovered, when the node emits the connection
// request, and when the connection is established.