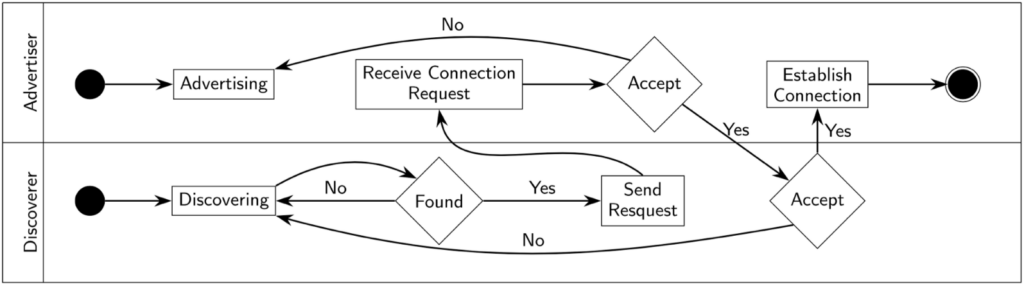
In IoT-NGIN, we use Nearby Connections as an off-the-shelf framework to showcase the project’s contribution toward device-to-device communications. Contributions include 5G coverage extension and direct link characterization. Recently, we have investigated Nearby Connections deeply and have derived several observations. In the following, we present a summary of them.
In a nutshell, the Nearby Connections API provides three strategies to establish D2D communications: CLUSTER, STAR, and POINT-TO-POINT. As their names indicate, they differ in the network topology and, consequently, in the flexibility that they offer to the application. CLUSTER allows (𝑛 × 𝑚) connectivity, STAR leads to a (1 × 𝑚) network, and POINT-TO-POINT constrains the topology to (1 × 1). Besides the topology, another fundamental difference is in their performance. While CLUSTER uses Bluetooth for data transfers, both STAR and POINT-TO-POINT rely on both Bluetooth and Wi-Fi. The high topological flexibility that CLUSTER provides is then highly penalized by much slower links.
The difficulty is to know exactly the performance differences between the STAR and POINT-TO-POINT strategies. Google gives some advice in their documentation but reality shows different numbers. In this work, we address exactly this point by digging into the operation of the Nearby Connections API. Our contributions are:
- We review the different strategies that Google proposes through the Nearby Connections API. We also identify the aspects that need specific attention from developers when designing their own applications on top of the API.
- We share with the community AtomD. A tool we developed to perform a number of tests of the Nearby Connections API. We show the steps we follow as well as a methodology that developers can follow to characterize their own setups.
- We report on the experiments we have run using different smartphones and discuss the performance that one may achieve in terms of throughput. As we will see, different strategies lead to very different performance levels, which forces developers to think thoroughly when deciding which strategy to adopt in their applications.
We conducted several experiments to evaluate the performance of the STAR and POINT-TO-POINT strategies using five Android smartphones. To ensure a strong and stable D2D wireless connection, we distribute these nodes no more than 20 cm away from each other. The distribution of the nodes consisted of placing one of them in the center while the other four smartphones were placed around, forming a square-shaped network topology. The Nearby Connections API version we used was 18.3.0.
To generate data, we configured our application (see blog post ”AtomD – An Android application for D2D measurements in real conditions”) to run a “file experiment”, in which the application generates and sends a 4 × 10^8 byte file. It is important to note that the Nearby Connections API splits large files into chunks of no more than 1,047,552 bytes. However, the exact sizes of the chunks depend on an estimation of the available bandwidth at the time of the transmission. As a consequence, we must run the experiment for enough time to avoid any bias due to a temporary condition affecting the bandwidth. This behavior can be seen in the example shown in Figure 1, where Node 3 received a file from Node 1.
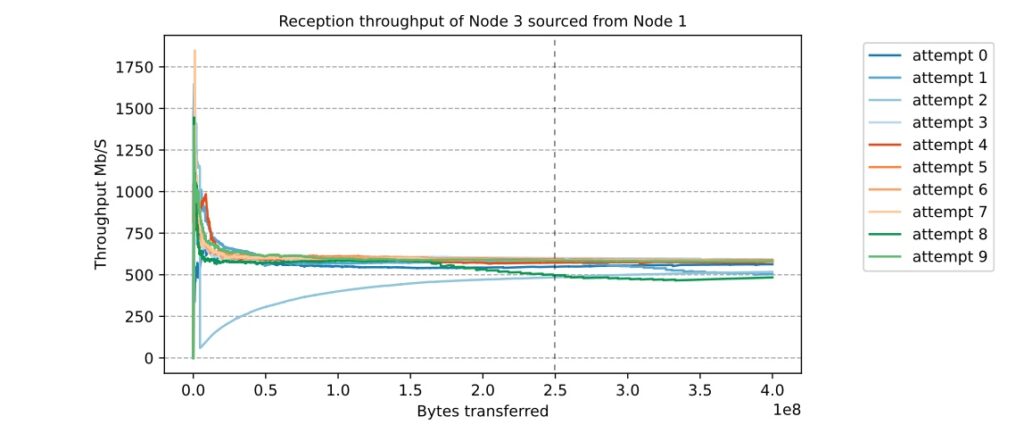
Therefore, we saturated the sample set with a large number of chunks to calculate the throughput accurately and performed ten runs of the same transmission to satisfy the reliability interval of the data. We can see that as chunks are received, the chunk’s saturation shows the actual throughput of the link. However, due to the random nature of wireless networks, each saturation point of each transmission may be at different zones. More specifically, while most of the saturation points of each transmission attempt converge to around 0.25 × 10^8 bytes, the saturation point of the third attempt reaches values of around 2.5 × 10^8 bytes.
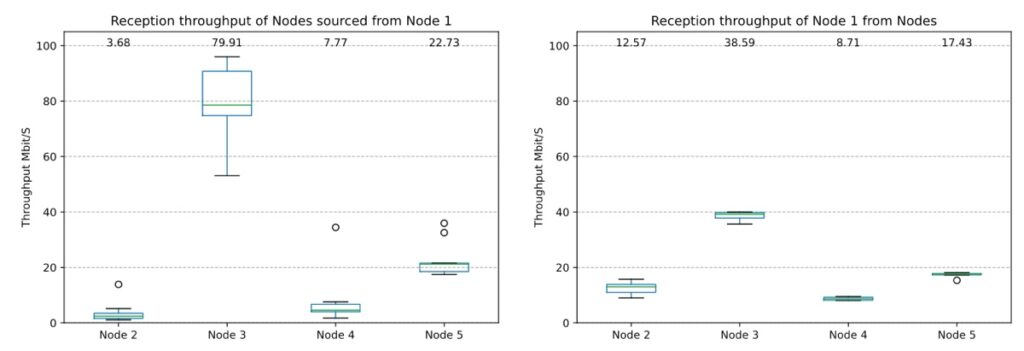
One of the results is illustrated in the following (Figures 2 and 3). Each boxplot represents data from the first (𝑄1) to the third (𝑄3) quartile, as well as the median. We also show the mean as a number at the top of the plot. Whiskers show the data range and extend no more than 1.5 × (𝑄3 − 𝑄1) from the box’s edges, ending at the furthest data point within that range. Outliers appear as circles.
Based on the results obtained using Node 1 as the Advertiser (Figure 2), we found that it lacked consistent throughput performance across all nodes. In fact, in both plots, it can be observed that the link between Node 1 and Node 3 has a better throughput than the other nodes, while the link performance of the rest of the nodes remains below the 20 Mbit/s. On top of that, we can observe that Node 1 has a better throughput performance when acting as a receiver (Fig. 6(b)).
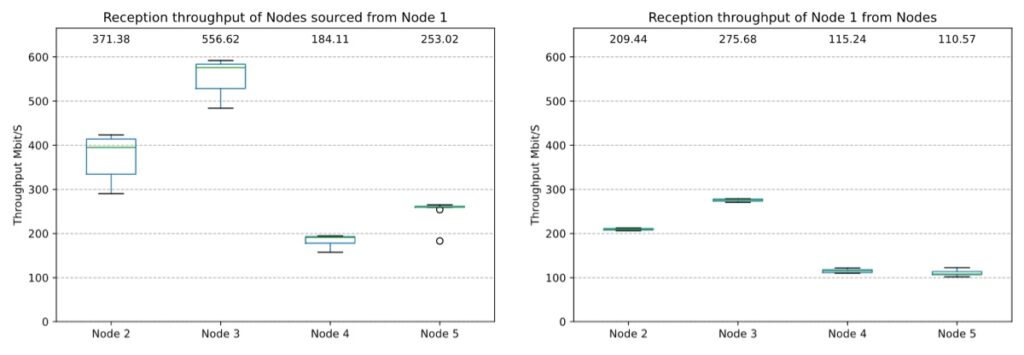
From the results obtained with Node 1 as the Advertiser (Figure 3), we can see that its throughput is higher when it acts as a transmitter (left plot). Furthermore, for each link generated, the throughput performance of each node doubled when Node 1 acted as a transmitter. Also, Node 1 has a better throughput with its link with Node 3 than the rest.
Among other observations we could make in our study, the one that we want to underline here is the asymmetric nature of the D2D links generated by the Nearby Connections API. Our results demonstrate that the performance of the links is highly dependent on the node established as the access point and the node to which it is connected. The results also indicate the importance of considering the nodes’ hardware characteristics when selecting the access point to ensure optimal throughput performance. The study added three reference nodes with similar parameters, which maintained a low coefficient of variation due to their similar hardware characteristics, resulting in better throughput performance. In contrast, other nodes had much higher coefficients of variation, resulting in worse throughput performance, representing the real case scenario.
Further details can be found in the following paper:
Tomas Lagos Jenschke, Marcelo Dias de Amorim, Serge Fdida, “Nearby connections strategies: Features, usage, and empirical performance evaluation”, Internet of Things, vol. 23, October 2023. (link)