Within the Smart City Living Lab of the IoT-NGIN project, Forum Virium Helsinki has taken the development of a dynamic dashboard aimed at showcasing tangible outcomes of congestion prediction to enhance urban mobility.
This dashboard functions as a comprehensive tool, delivering valuable insights derived from real-time data streams from diverse sources, such as Smart Junction infrastructure data, Digitraffic’s Marine data, and Twitter/X feeds.
Tailored for urban transportation stakeholders, it offers a unified view for evaluating transportation demand in Jätkäsaari, forecasting congestion levels, and recognising significant events throughout Helsinki that might affect the traffic.
The dashboard is particularly tailored to address the needs of stakeholders, providing a concise overview of traffic patterns within the streets of Jätkäsaari, dynamics of congestion, and notable citywide events.
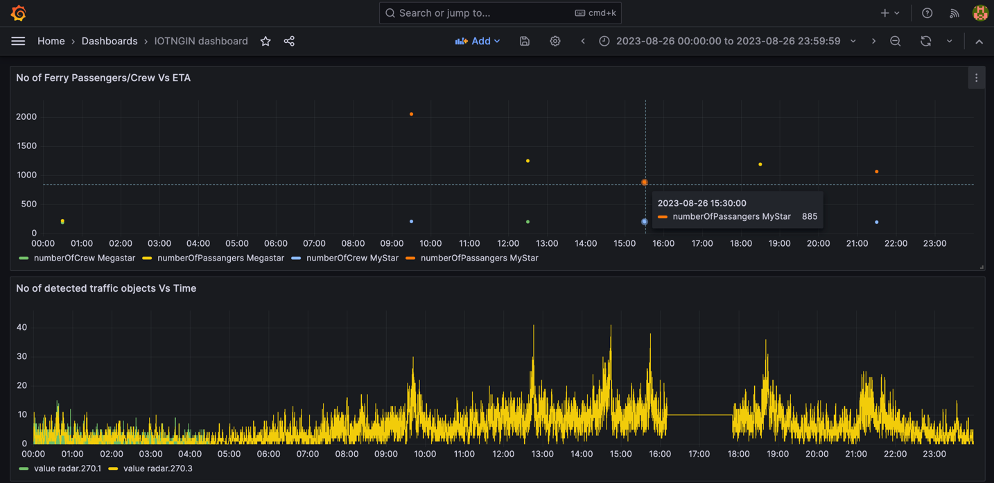
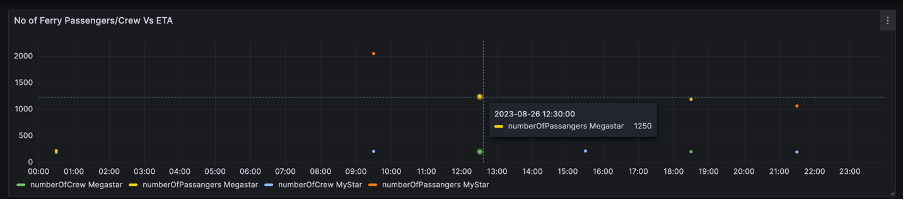
The dashboard currently displays two primary graphs. The first graph portrays Digitraffic’s Marine data, with the x-axis representing the estimated time of arrival (ETA) and the y-axis indicating the number of ferry passengers/crew.
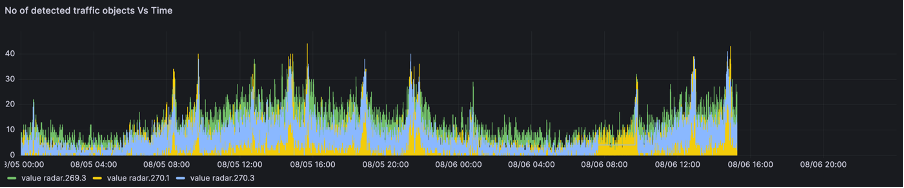
The second graph illustrates the visualisation of Smart Junction radar data, featuring time intervals on the x-axis and the count of detected traffic objects on the y-axis from 3 radars.
Additionally, users have the flexibility to modify the displayed time intervals according to their preferences.
One of the noteworthy features of the dashboard is the congestion indicator, a visual representation ranging from low to high, which offers a rapid assessment of the city’s mobility demand on a very specific street in Jätkäsaari leading from and to the harbour terminal. This indicator is a result of an analysis of historical/real-time data utilising factors such as estimated ferry arrival times, the number of registered passengers, and previous instances of congestion triggered by similar situations. Such information is also presented on the dashboard. By harnessing a combination of data and the capabilities of IoT-NGIN’s MLaaS, a predictive model is being constructed to generate this indicator.
As the dashboard evolves, upcoming enhancements will introduce Twitter/X hashtag counters, depicting events that potentially can affect the traffic, and a traffic prediction indicator. These additions will further enrich the depth of insights and data-driven decision-making capabilities for stakeholders.