
In the ever-evolving landscape of the Internet of Things (IoT), ASM Terni S.p.A. has embarked on a pioneering journey as a living lab and data integrator. Within the ambitious IoT-NGIN project, ASM Terni has played a pivotal role in shaping the future of data integration and visualization. One of the achievements of this collaborative effort is the creation of a visualization dashboard, poised to visualize the MV network’s parameters (estimated and optimized), as well as the data from smart meters (only real data). The dashboard, however, will be used to gather and display all the services provided by different services. The goal of this dashboard is to access and connect with integrated services by different partners and finally share the results of the forecasting service in the dashboard in real time.
With all gears in motion, this service is now prepared to be deployed in the project’s concluding phase, fortified by an alliance with the technical prowess of ENG, SYN, and ATOS. This dashboard has been developed by ENG and includes three data providers. The first data is a historical SQL dataset and MQTT broker provided by the ASM database. The second section includes grid optimization output, which has been implemented by ATOS during the IoT-NGIN project. Further enriching this spectrum is ASM’s partnership with SYN, culminating in the creation of device indexing, in order to access and visualize historical data.
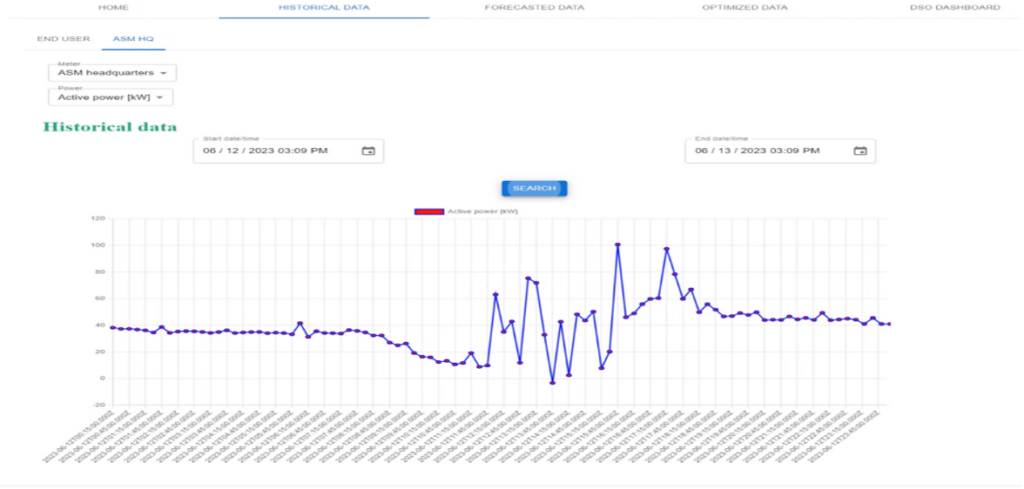
The imported data is accessible as an averaged value every 15 minutes. The dashboard’s homepage showcases vital grid parameters, data sources, and services and the user can delve into actual, forecasted, and optimized data from diverse sensors. In the first tab, historical data can be visualized which include power data (active, reactive, and apparent power) related to PV generation, EV charging station, ASM headquarters, and end users. Moreover, the forecasted and optimized data is also visualized in the dashboard.
In general, the dashboard involves historical data for a precise list of sensors subscribing to the MQTT Broker of ASM, historical-time data can be obtained for a precise list of sensors accessing the SQL database, forecast data for a precise list of sensors accessing the ASM server via Exposed Prediction Service, optimized data for a precise list of sensors, accessing the ASM server.
In addition, another task is the integration of various sensor data into the ASM Terni device indexing ecosystem to be visible on the dashboard. This visual representation will give us an easy-to-understand snapshot of the overall system performance. The open-call beneficiary ENERGIOT has yielded another milestone – a dedicated dashboard page to display sensor measurements. This will be accomplished by calling the appropriate endpoints that need to expose information in JSON format. While our focus remains on this integration, it’s important to note that sensor adaptation falls beyond our scope, with responsibility shared based on where sensors are incorporated into the device-indexing ecosystem.
As the project’s final phase unfolds, we are thrilled to present the visualization dashboard for device indexing – a testament to ASM Terni’s commitment to innovation and collaborative progress. Join us on this journey to transform the IoT landscape, one integrated data point at a time.