
As suggested by the authors this mathematical methodology is very general and can be applied for asset management and predictive maintenance on a battery, an EV panel, or in general to a physical asset of a critical infrastructure.
In particular, this approach can be fine-tuned and tailored for a battery in an IoT environment. The model of such ‘thing’ given the knowledge of maintenance actions, physical model of the sensor and actuator available on the battery itself, as well as the AI models for the battery lifespan allow us to assess, with a certain degree of precision, the prediction about the lifetime of the battery.
Generally speaking, a digital twin is defined as a set of virtual information that mimics the behavior and the structure of a physical asset. This set of information takes the shape of a software artifact that is updated with data from the physical twin (the physical asset associated to the digital twin) during its entire lifecycle. Different applications of such digital twin span from health monitoring, predictive maintenance to -at a larger scale- smart cities.
In this case the digital twin model will be described by a probabilistic graph theory so to have a deep modelization for the dynamics between digital and physical twins to enable the researcher to make prediction about the physical underlined asset.
This modellization is illustrated by means of six key qualities extracted from figure 1.
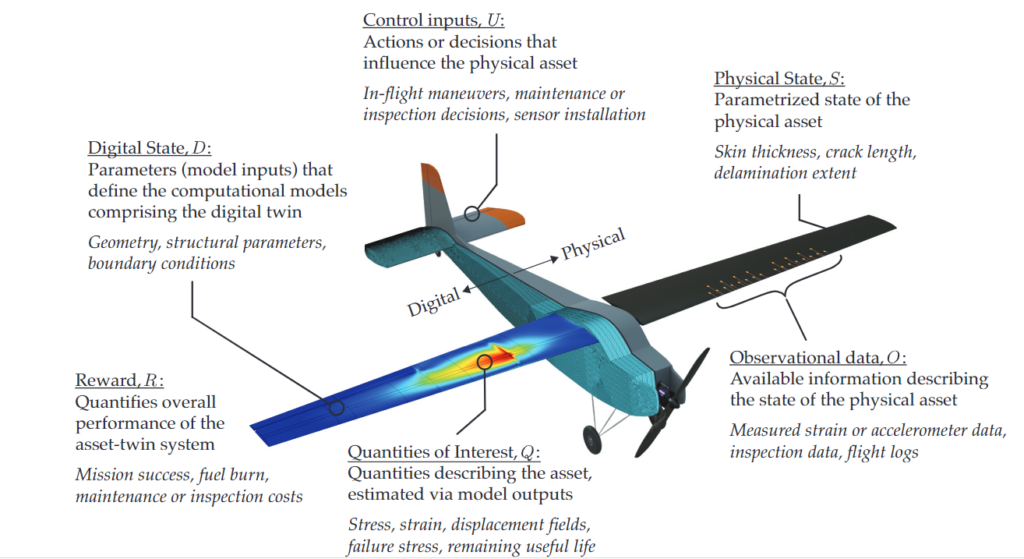
Figure 1 – Digital twin abstraction extracted from [1]
In this figure we have two kinds of model, the digital and the physical, and the following variables to take in account:
Control inputs: Actions or decisions that influence the physical asset (Action on the physical asset, maintenance or inspection decisions, sensor installation)
Physical State: Parametrized state of the physical asset
Digital State: Parameters (model inputs) that define the computational models comprising the digital twin
Reward: Quantifiers that proxy the overall performance of the asset-twin system (energy production, maintenance cost, etc.)
Quantities of Interest: Quantities describing the asset, estimated via model outputs: (Remaining charge in a battery pack, etc.)
Observational data: Available information describing the state of the physical asset (Measured energy production / consumption, etc.)
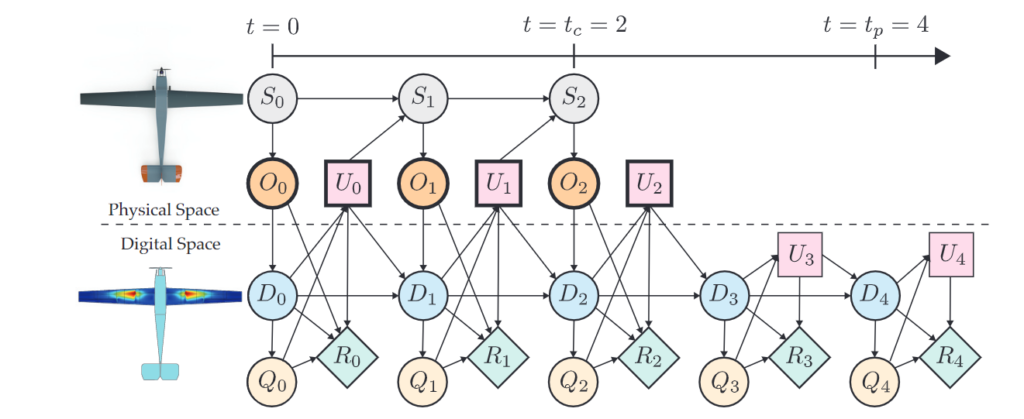
Figure 1 – Digital and physical twin dynamic as decision network [2]
In general, Information flows from the physical asset -in this case could be an airplane- to the digital twin in the form of observational data which are assimilated in order to update the digital state. Using the updated digital state, the models comprising the digital twin are used to predict quantities of interest i.e. the variables that we would like to predict. After that, information flows from the digital twin back to the physical twin in the form of control inputs which are informed by the digital state and computed quantities of interest. These quantities all influence the reward for the next time step and so on.
More in detail for building the probabilistic graph model we can proceed as follows using the six variables described above.
We have a physical state S evolving from S0 to S1 … S2 (following a conditional probability) and in parallel we have the evolution of the digital twin the moves from D0 to D1, D2 (also this transition happens following a probability distribution because all the variables are random variables). In this scenario what is possible to measure on the physics state is the variable O that is a subset of all the states available to the physical system. From this, it is then possible to calculate as inference problem the value of D0.
Said that, in the next time step (t=1) the D1 state depends on the condition probability O at time t=1 as well as D(t-1) but also on the action U taken in the previous time step t-1.
Then, there are the actions on the system and that modify the state of the physical and the digital asset at time t=1, and finally the quality of interest that I would like to predict from the digital twin and that guides also the action to do on the system. From t1 on, the graph follows the same dynamics and we can imagine of extending it in the future.
From this, the mathematical model of the digital twin follows as a joint probability distribution that represents the relationship among the digital twin state, the quality of interest, the reward, the future control actions all conditioned on what we have observed in the past.
This brings to the following formula, enabling the predictive digital twin.

It is important to note that the proposed probabilistic graphical model does not restrict the nature of the models comprising the digital twin. Each of these models could be physics-based (for example, models based on discretized partial differential equations) but also data-driven based (for example, neural networks trained on historical or experimental data).
References
1
Kapteyn, Michael G., Jacob VR Pretorius, and Karen E. Willcox. “A probabilistic graphical model foundation for enabling predictive digital twins at scale.” Nature Computational Science 1.5 (2021): 337-347.
2
https://kiwi.oden.utexas.edu/research/digital-twin